Although the COVID-19 pandemic is well past two quarters in length, U.S. office-market statistics are just starting to be impacted. The national office-vacancy rate climbed to 17.4% in third-quarter 2020 as occupancy fell by 5.85 million square feet. This was the highest vacancy rate since 2011.
The average asking rent, however, increased by 0.2% while the average effective rent declined by 0.2% from the prior quarter. The effective-rent decline was not as significant as many would expect given the number of jobs lost thus far, as well as the fear that the success of working from home for many business activities has prompted questions about the future of office demand.
Before addressing the office market in more depth, let’s take a step back and look at the bigger picture for employment numbers. In the 2010-2020 expansion, the U.S. added 20.3 million jobs before losing 25.3 million this past March and April alone. As of September 2020, the nation had regained 14.1 million jobs for a net decline of 11.2 million jobs (or 7%) from the peak this past February.
Looking closer at individual industries shows that job declines have been heavily concentrated in a handful of sectors, mostly related to tourism, while office-based employment has seen far fewer losses — 1.8 million jobs or a 5.5% drop-off since February. Moreover, the bulk of these office-using job losses were not in high-paying sectors such as legal or finance but in lower-paying sectors such as employment services, a category that includes all temporary workers. This sector shed 552,000 jobs between February and September, or nearly 30% of all office-using job losses.
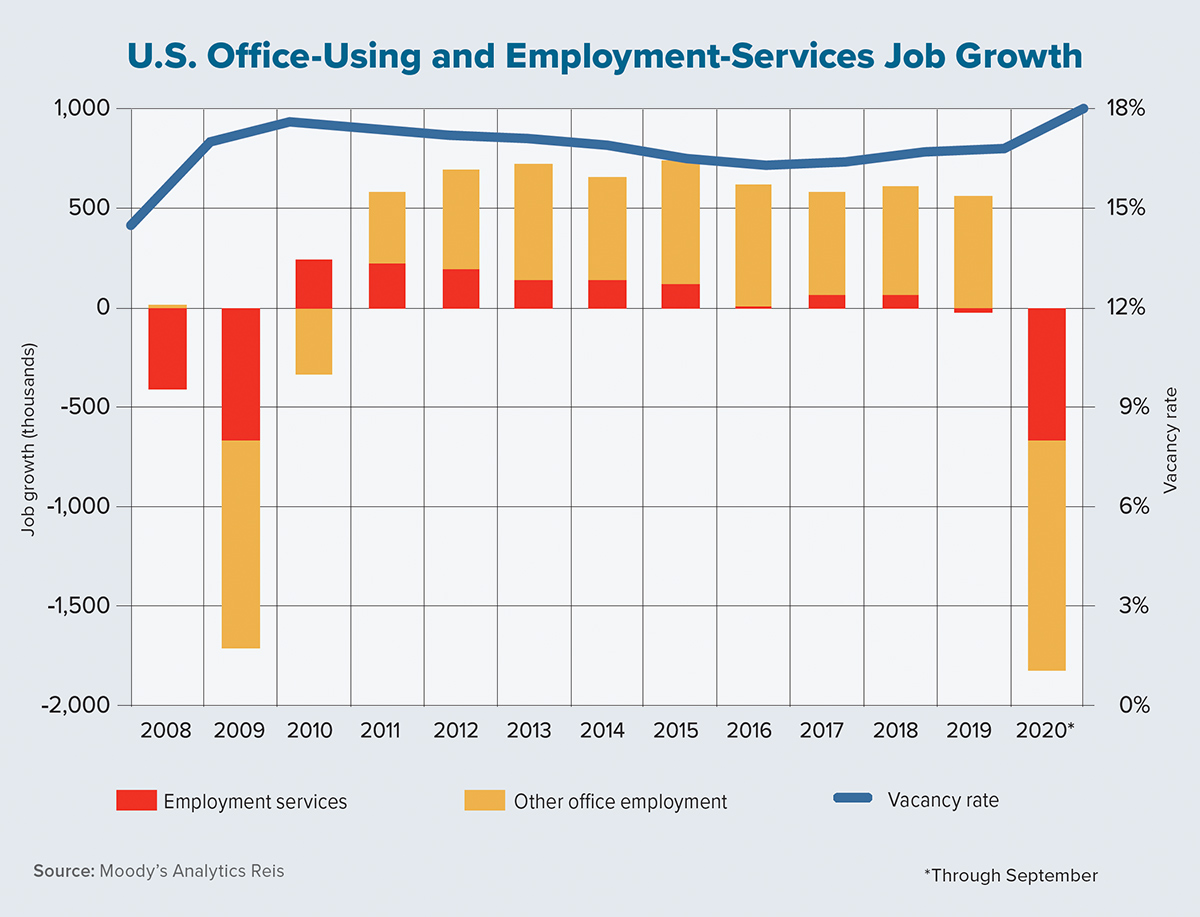
Removing this segment of office jobs puts the net office-job loss at 4.3%. The chart on this page shows the annualized growth for employment services and the remainder of the office sector. Notice how in good years, employment services add smaller shares of jobs, while in bad years, the sector sheds significant numbers. A look at metro-level office-job losses provides a compelling story as to why office-occupancy statistics have not shown distress. In many metros, the office-job losses were concentrated in this employment-services category.
Take Austin and Colorado Springs, Colorado, which added office jobs during the first nine months of 2020 while losing jobs in employment services. These two markets had office-occupancy growth of 3% and 0.9%, respectively, since the start of the year. Dallas-Fort Worth had positive occupancy growth, too, mixing small office-job declines with larger declines in employment services.
Among the top 10 metros with the highest office-occupancy gains in 2020, job losses in employment services accounted for 55% of all office-job losses — an indication that high-paying jobs in these metros sustained smaller shares of the losses. In addition to Austin, this group includes Salt Lake City, Phoenix, Seattle and the North Carolina metros of Charlotte and Raleigh-Durham, which saw occupancy gains of 1.5% or more this year through September.
Meanwhile, across the bottom 10 metros with the heaviest occupancy declines, losses in employment services accounted for only 45% of the aggregate office-job losses. This group was led by Tucson, Arizona; Oklahoma City; Richmond, Virginia; San Antonio; Houston; and Orlando, which incurred occupancy declines of 1.2% to 4.2% during the first three quarters of 2020.
The U.S. average effective rent increased by 0.5% annually as of third-quarter 2020. Across the 82 metros that Moody’s Analytics Reis tracks, however, 50 incurred an annual decline in effective office rents. Syracuse, New York; Milwaukee; and Orange County, California saw the biggest declines, ranging from 1.5% to 3.5%.
Many industry experts expected that the declines would be steeper by now. Indeed, our forecast is for much of the office-market distress to occur in 2021 as rent declines are expected to accelerate. Our longer-term forecast predicts workers to be back in the office — and for occupancy to return to its second-quarter 2020 peak — by the end of 2023. ●