
At first glance, the U.S. apartment market appears to have reaccelerated in 2018 after slumping a bit in 2017. More than 195,000 new units were absorbed in 2018, up from the 178,000 units absorbed in 2017 but down slightly from 209,000 units in 2016.
A closer look at the data, however, reveals that the difference in 2018 had more to do with a shift in occupancy rates for Class B and C assets rather than a shift for Class A properties.
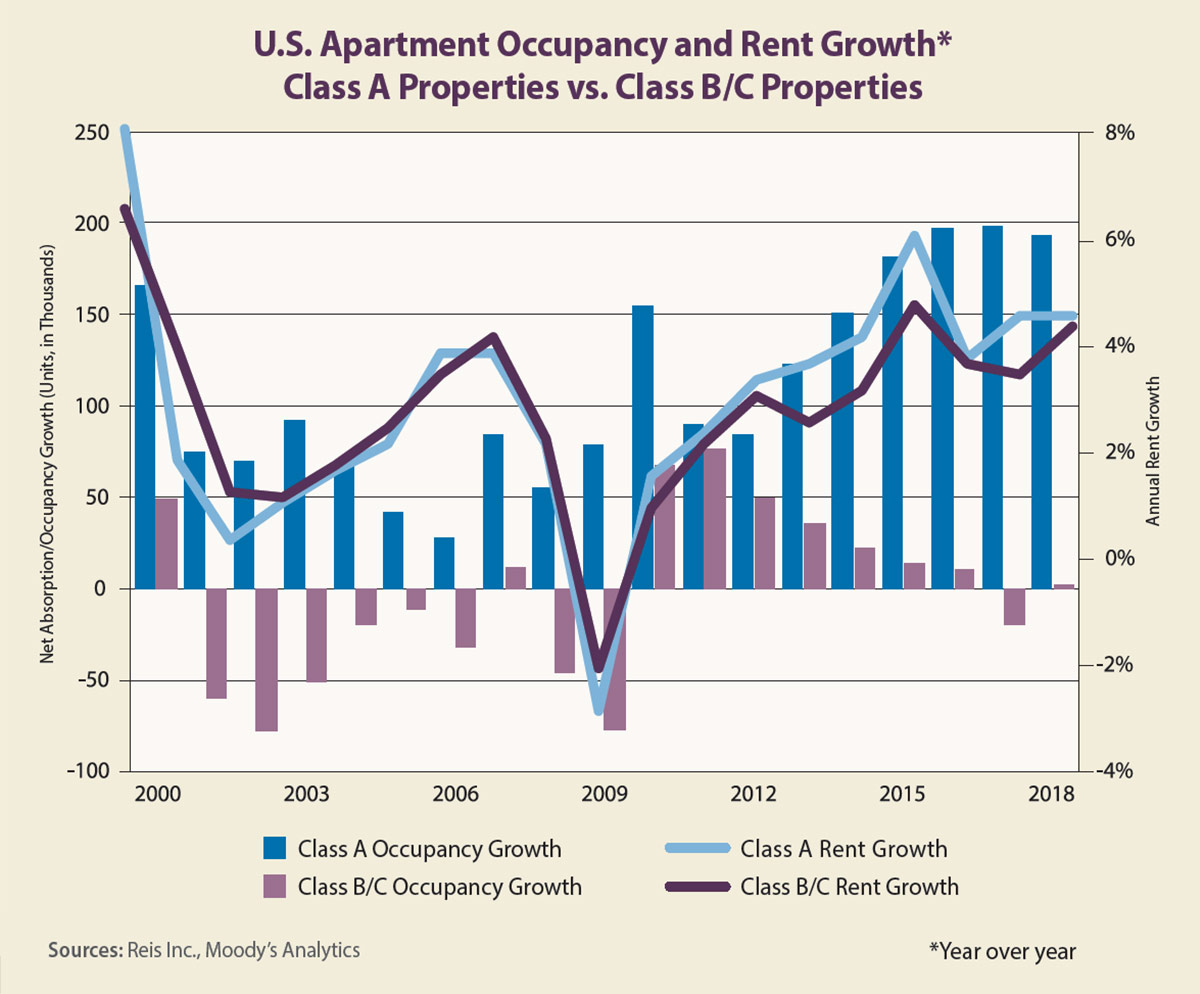
In the chart on this page, note that the absorption rate for Class A assets fell slightly year over year in 2018 after holding steady in 2017. At the same time, the Class B/C occupancy rate was flat in 2018 after declining in 2017. This suggests that renters took a moderate flight to higher-quality apartments in 2017, as many more Class A units were added to the nation’s inventory.
The accompanying chart begs the question: why the flight to quality in 2017 but not in 2018? Rent-growth trends suggest that a lack of affordability in the overall apartment market kept tenants in lower-priced units from leaving.
Note that Class B/C rent growth was 3.5 percent in 2017 despite the negative net absorption. Landlords seemed confident that they could sacrifice occupancy in order to reap higher rents. The vacancy rate for Class B/C assets had fallen to a 16-year low of 3.1 percent at the end of 2016, so it is easy to see why landlords felt confident. Indeed, Atlanta, Chicago and Dallas incurred some of the highest negative net absorption rates in 2017 within their B/C markets, yet each saw rent growth of more than 3 percent for these properties.
A deeper dive into the metros in 2018 shows that cities with some of the highest Class A rent growth also saw negative Class B/C absorption, reinforcing the flight-to-quality trend. These metros include Las Vegas, Cleveland, Atlanta and Philadelphia.
At the other end of the spectrum, however, metros with weak Class A rent growth had negative Class B/C net absorption as well. These include Fairfield County, Connecticut; Providence, Rhode Island; Central New Jersey; and Westchester County, New York.
The relatively strong Class A absorption numbers for these metros indicate that some tenants still sought better quality, while others may have fled the area because of declining affordability and a weaker job market. The higher growth rate for Class B/C rents relative to Class A rents in these markets suggests that affordability is still an issue there.
Among metros with the highest B/C net absorption rates in 2018, Houston topped the list. Due to Hurricane Harvey, however, Houston also incurred the highest negative net absorption of B/C units in 2017. Other metros with strong B/C absorption last year were those that also had high Class A absorption, such as Los Angeles; Phoenix; Austin, Texas; and Denver.
In these markets, job growth was strong, apartment-construction rates were high and, oddly enough, rent growth for both Class A assets and B/C assets were above average. This suggests that landlords remain confident in many metros and will likely continue to raise rents — for both Class A and Class B/C properties — at the same steady pace unless something starts to give, such as a spike in the vacancy rate. With home prices increasing faster than rents in many markets, this is unlikely.