
Back in July, it looked like the industrial sector was coming down to Earth. While the narrative still holds true, nationwide effective rents increased slightly to 0.7% in the third quarter of 2024 versus a 0.3% change in the preceding quarter. Even so, effective rents are approximately 45% higher than year-end 2019 and are on pace to finish 2024 up in the mid-2%.
The acceleration in rent growth this quarter can likely be attributed to a significant pullback in warehouse and distribution completions, which declined to about 9.6 million square feet. For perspective, this was the lowest level since 2013 and significantly below the 2020-2023 average of roughly 60 million square feet per quarter.
Consequently, inventory growth increased at a compound annual growth rate of 3.1% over roughly the last five years, well above the sector’s long-term average of 1.9% since 2009. Combined with the effects of higher interest rates since March 2022, it was only a matter of time before the numbers reflected a pullback in new supply.
That being said, the fundamentals for the industrial sector remain solid. Even though the third quarter marked a significant slowdown in completions, the market is actually characterized by excess supply conditions. For instance, defining excess supply as net absorption less total completions on a rolling 12-month basis, divided by the size of the U.S. industrial market, this yields a ratio of -0.9% at the end of September.
Theoretically, a market where supply and demand are perfectly in balance would have a ratio of zero. Excess supply likely peaked around the end of 2023 when the ratio was -1.9%. Thus, as new construction moderates and demand stabilizes around a new normal, expect this ratio to increase, indicative of a more balanced equilibrium over the next two years.
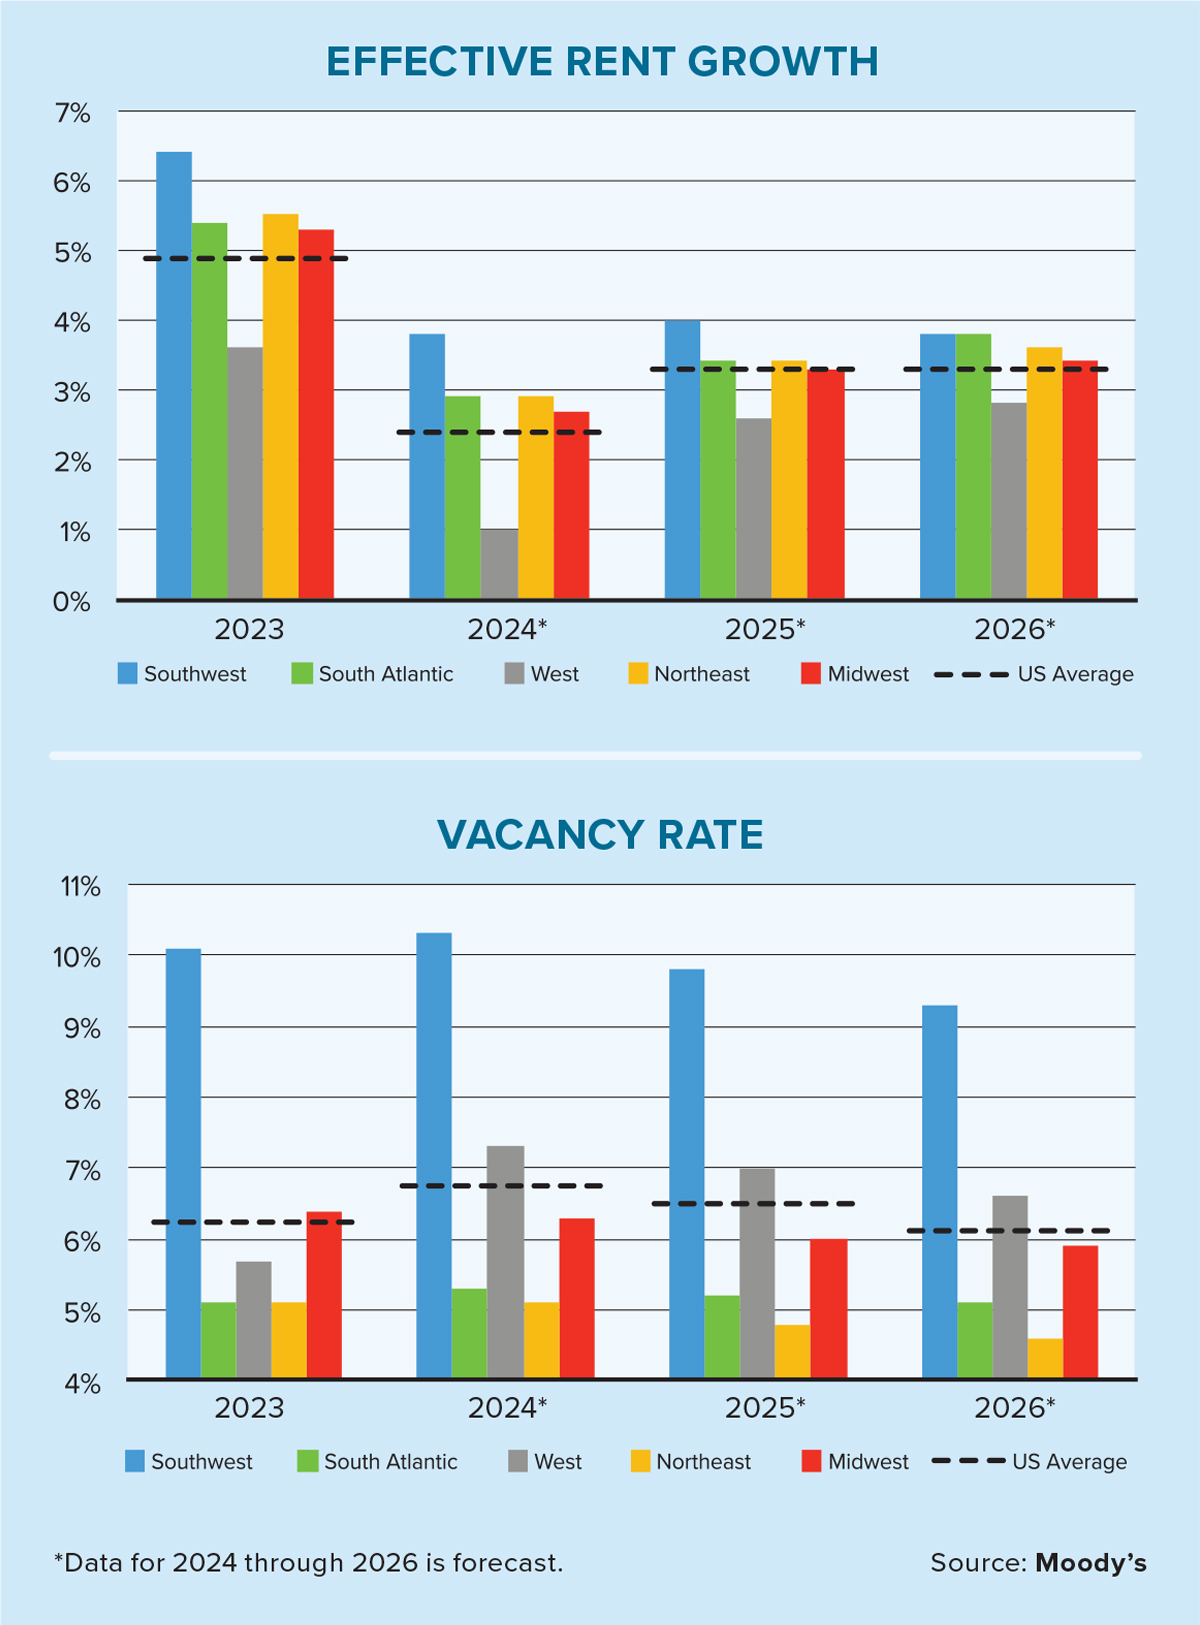
As such, with excess supply conditions expected to abate, this will likely bode well for rent growth in 2025 and 2026. The two charts on this page juxtapose Moody’s effective rent growth and vacancy rate forecasts over the next two years. The average vacancy rate — shown by the dashed black line — should decline to the mid-6% range in 2025 and the low-6% range in 2026. That puts effective rent growth in the low 3% range annually for each of those years.
There are notable geographic differences, however, with the vacancy rate in the Southwest, for example, projected to remain well above the other four regions. Moreover, you’ll also notice how effective rent growth has been slowest in the Western region, which is projected to remain a laggard over the forecast horizon.
Unsurprisingly, the West Coast’s underperformance circles back to supply conditions, with markets in Southern California such as Los Angeles, San Bernardino/Riverside, Orange County, and San Diego being particularly affected. Specifically, San Bernardino/Riverside saw its vacancy rate rise by 340 basis points (bps) year-to-date to 10.1% — the national average rose by 50 bps to 6.8% as of the third quarter.
Despite 2024’s slowdown, tailwinds from e-commerce and reshoring (and nearshoring) are expected to persist. E-commerce’s share of retail sales has been steadily increasing over the past couple of decades, and although it’s below the all-time high of 16.4% from four years ago, the uptrend remains intact. Trade policy has also been an important topic this election cycle. With a new administration slated to take the White House on Jan. 20, it will be interesting to watch how any protectionist policies affect the sector.