
The U.S. apartment market closed out the second half of 2025 with a surprising downturn, wiping out the performance gains achieved earlier in the year.
Supply-side pressure persisted across the market. Verified annual completions of institutional-grade apartments — defined as properties with at least 40 units (20 units in California and Arizona) — were down 20% from a year earlier and were 23% below the cycle peak reached at the start of 2025. Even so, the average 12-month delivery pace across all four quarters still exceeded 2023 levels, surpassing 300,000 units for the second consecutive year.
Household growth has slowed, particularly among the prime renter demographic aged 25 to 44. Over the past 18 months, growth in this age group has decelerated, driven in part by a decline in the foreign-born population amid restrictive immigration policies. Additionally, more young adults are remaining in shared living arrangements, either with parents or roommates, due to limited financial flexibility and a lack of viable “trading-up” options.
Recent supply-demand dynamics have kept the apartment market soft, as reflected in an elevated inventory multiplier. Over the past 25 years, national multifamily inventory has grown at twice the pace of household formation.
The inventory multiplier — defined as the ratio of annual multifamily inventory growth to household growth — signals oversupply when it exceeds 2, typically leading to higher vacancy rates. Conversely, values below 2 indicate undersupply and downward pressure on vacancies.
For 2025, the average inventory multiplier stands at 2.8, the highest since 2020. While the numerator (supply growth) has slowed sharply, the denominator (household growth) has slowed even more, keeping the ratio elevated. As a result, the average vacancy rate rose by 10 basis points to 6.7%, the highest since 2010.
With occupancy under pressure, rent declines accelerated. In the final quarter of the year, both asking and effective rents fell 0.8% to $1,910 and $1,815, respectively — deeper than the 0.1% drop in the prior quarter and marking the steepest quarterly decline in five years.
Two quarters of rent declines brought the average asking and effective rents back to their respective year-ago levels, resulting in zero year-over-year rent growth. That is welcome news for rental affordability, but the actual rent burden extends beyond headline metrics. Lower-income renter households, particularly those earning less than 70% of the area median income, continue to face rent burdens well above the accepted threshold.
At the higher-income end of the renter spectrum, options to trade up or transition to homeownership are constrained by mortgage rates above 6% for a 30-year fixed-rate mortgage, ongoing year-over-year home price increases and persistently high costs for insurance, utilities and property taxes. These households face a dual challenge: elevated Class A rent premiums and prohibitively expensive homeownership.
This dynamic is reflected in the multifamily class performance trend shown in the chart below:
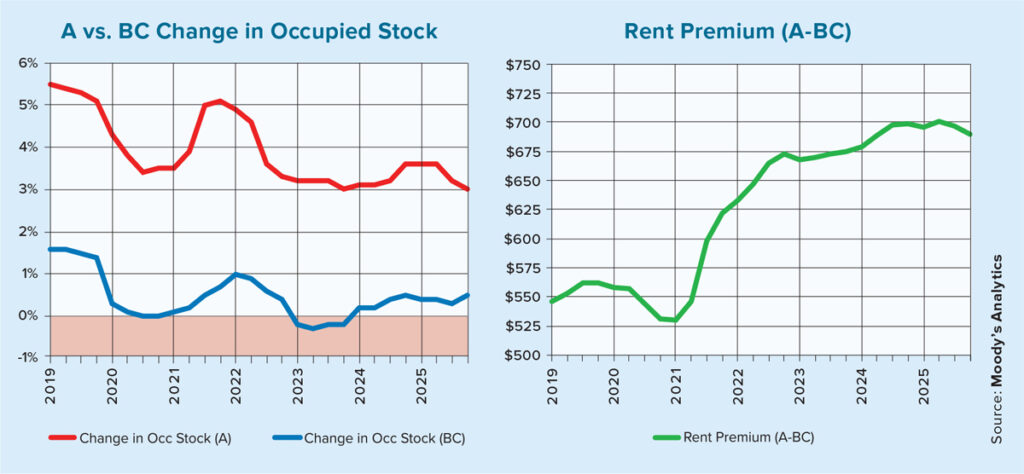
Demand for more affordable Class B and C rental properties has been steady over the past two years, with a change in occupied stock accelerating in the final quarter of last year.
By contrast, the year-over-year change in occupied stock for Class A properties, defined as buildings in the top 30% of asking rents in their local market, decreased 20 basis points, causing the premium for Class A over B and C properties to decline by 1%.
The Class A vacancy rate finished the year at 8.1%, and rents declined by 60 basis points, illustrating the heightened affordability pressures among luxury properties.
Looking ahead, although recent housing starts data indicates a modest rebound from the cyclical trough, near-term investment appetite is likely to remain subdued due to weaker demographic trends, elevated construction and financing costs and compressed performance gains. Institutional-grade multifamily completions are projected to continue declining over the next two years, with stabilization anticipated beyond 2027.