The wholesale mortgage channel has been in the spotlight lately as brokers have found success in the high interest rate environments of late 2022 and 2023. Thanks to the wide range of products and pricing available through wholesale lenders, brokers can use creative problem-solving skills to help borrowers who may not qualify elsewhere.
Brokers significantly increased their representation in this year’s Scotsman Guide Top Originators rankings.
In the Most Loans Closed rankings (which were published in April and include every Top Originator who closed at least 100 loans last year), brokers made up 13.4% of the list. Last year, brokers accounted for only 4.3% of the same list. And with nonqualified mortgages (non-QM) gaining steam, brokers have increased their representation in the Top Non-QM Volume rankings as well. Last year, brokers made up 17% of the Top Non-QM list, but they nearly doubled their share this year to comprise 33% of the list.
The broker channel also has continued to gain share in the overall mortgage market. According to a recent report from the Stratmor Group, using data from Inside Mortgage Finance, the wholesale share of the market was consistently in the 14% to 16% range from 2011 to 2017. It began to rise in 2018 and has stayed between 18% and 21% since then, reaching 20% in 2022.
Top wholesale lenders have been increasing their share in the broker channel as other lenders have exited. As of 2022, the top-three wholesale lenders controlled 54% of the wholesale market, according to the Stratmor report. And as wholesale lenders continue to expand their loan product offerings while targeting underserved borrowers, self-employed borrowers and more, the wholesale channel may continue to grow its share of the market.
Over the following pages, you’ll see the top 150 producers on Scotsman Guide’s 2023 Top Mortgage Brokers list. Returning to the top spot is Mark Cohen of Cohen Financial Group, who brokered $751.4 million last year across 552 loans. Cohen was previously the No. 1 broker in the 2020 rankings, when he closed 515 loans for an aggregate volume of $584 million.
Second place this year went to Thuan Nguyen of Loan Factory Inc., who originated $475.7 million across 1,359 loans. Rounding out the top five are Mike Roberts of City Creek Mortgage ($309.4 million), Damon Germanides of Insignia Mortgage Inc. ($285.5 million) and Amit Sakhrani of TransUnited Financial Services Inc. ($260.9 million).
From the top 150, Scotsman Guide chose four brokers to interview and feature. From up-and-comers to company presidents, these brokers have found great success by investing their time and energy in the wholesale channel. All four listed flexibility, good pricing and better product availability as major benefits of the broker channel. Read their stories here.
Next month, we’ll launch a brand-new ranking, Top Jumbo Originators, which will highlight originators by average loan size. We’re looking forward to sharing it with you, but until then, enjoy the end of summer. As always, thank you for reading.
Sun Belt metros lead the home flip charge
Home flips are happening at the highest levels in decades. Nearly 73,000 single-family homes and condominiums were flipped in the first quarter of 2023, according to Attom, making up 9% of all sales. The only time this century the figure has been higher was in Q1 2022, when home flips accounted for 9.4% of all sales.
Across U.S. metro areas with a population of at least 200,000 and 50 or more home flips in Q1 2023, the hottest locations were Macon, Georgia; Atlanta; Jacksonville; Memphis; and Clarksville, Tennessee. In each of these five metros, flips represented more than 14% of home sales. Unsurprisingly, the counties surrounding these metros also saw high percentages of home flips, led by Baker County, Florida (outside Jacksonville), where flipped homes made up 22.7% of all sales.
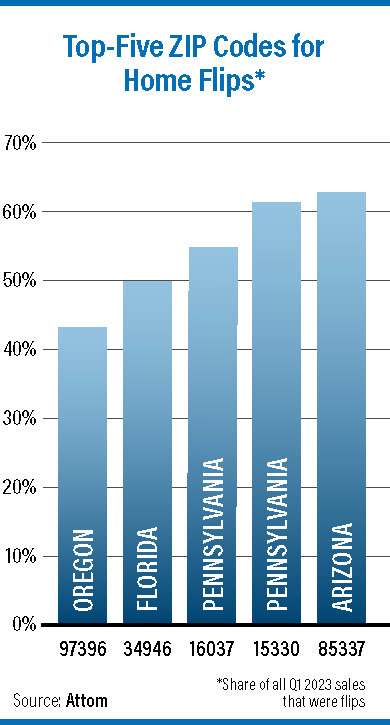
Across individual ZIP codes, Attom found that three of the top 10 ZIPs for flips in Q1 2023 were in Pennsylvania and two were in Arizona. Florida, Ohio, Oregon, Texas and Washington each had one ZIP code in the top 10. The top ZIP code, where flips accounted for 62.5% of all sales, was 85337 in Gila Bend, Arizona, about an hour southwest of Phoenix.
Walkable communities remain desirable
Residents of the 50 largest U.S. metro areas who live in walkable communities are more likely to be “very satisfied” with their quality of life, according to the 2023 Community and Transportation Preferences Survey from the National Association of Realtors (NAR).
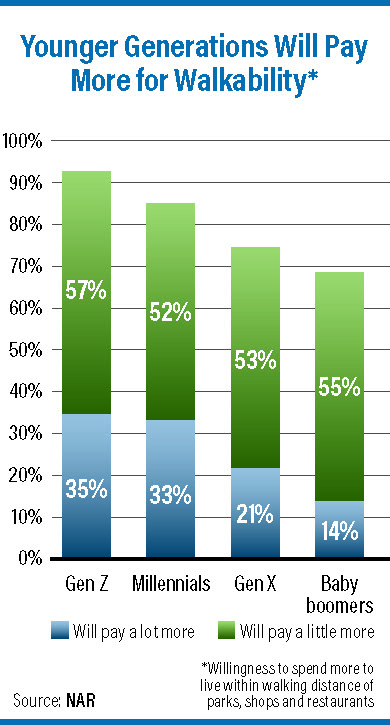
The survey found that 79% of respondents determined it important to live within easy walking distance of shops, parks and other amenities, while 78% of this group said they would pay more to live in a walkable community. There were generational differences in the willingness to pay more for walkability. While 33% of millennials and 35% of Gen Zers said they would pay “a lot more” to live somewhere walkable, only 14% of baby boomers and 21% of Gen Xers said the same.
Among those who already live in walkable neighborhoods, 89% said they were satisfied with the quality of life in their community, with 48% reporting that they were very satisfied. While 81% of people in “somewhat walkable” neighborhoods and 74% of “somewhat unwalkable” neighborhoods also reported satisfaction with their quality of life, only about one in four respondents were very satisfied.
Construction activity rises as costs stabilize
Texas and Florida are leading the nation in residential construction permit approvals, according to CoreLogic’s Quarterly Construction Insights report for Q2 2023. In the first three months of this year, about 200,000 building permits were authorized in the South region. Texas and Florida each had more than 50,000 authorizations to sit atop all states. Most of these permits were for single-family units, the report noted.
Housing starts were down slightly between Q4 2022 and Q1 2023, but building permits were up slightly to a seasonally adjusted annual rate of 1.434 million. Sales of both new and existing homes also improved on a quarterly basis.
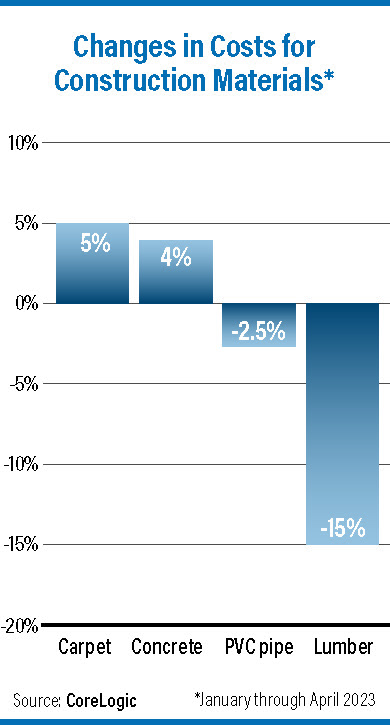
Inflation has increased the expenses for many construction materials, including concrete, bricks, insulation and carpet. This contributed to an overall quarterly increase of about 2% for residential construction costs. Costs for other materials, however, were declining. Lumber costs in the U.S., for example, dropped by 15% in the first four months of 2023. Prices for plywood, rebar, steel studs and PVC pipe decreased as well.