
Economic uncertainty rules the day, from ever-changing information about tariffs to concern over pending federal legislation. The residential real estate market seems to reflect that. Although home prices remain high, several areas around the country are more vulnerable to declines, according to Attom’s first-quarter 2025 Special Housing Risk Report.
The report analyzed county-level data, looking at home affordability, equity and foreclosures. It also identified the proportion of seriously underwater mortgages and unemployment rates to rank the most at-risk areas in the 572 counties with enough data to be included.
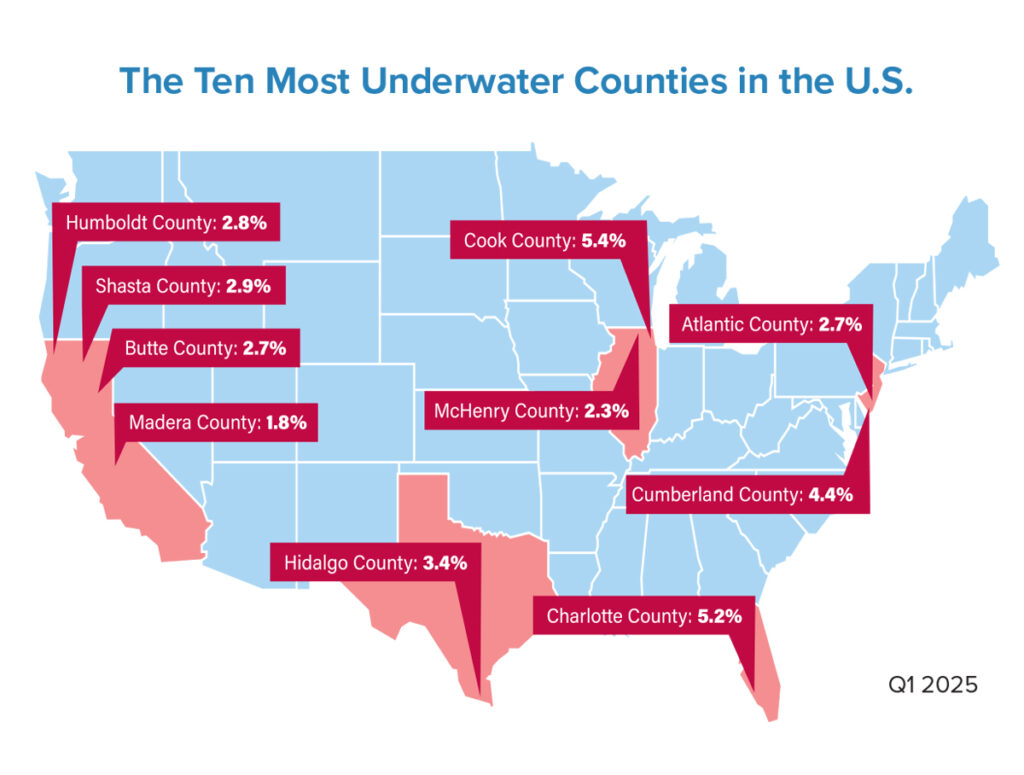
Out of the top 50 most vulnerable locations this past first quarter, 23 were from either California (14) or New Jersey (9). In fact, the three most at-risk counties in the report were in Northern California: Butte, Humboldt and Shasta counties. These areas have suffered from wildfires in recent years, which, combined with economic challenges, contributed to their risk assessment. New Jersey’s Atlantic and Cumberland counties took the next two spots in the top five most at-risk ranking. These areas are further from the New York City metropolitan statistical area, along the southern coast of the state.
While data analysis isn’t a crystal ball into the future, it does give those working in the real estate industry perspective on the forces that may move a given area toward a better or worse outcome should market winds shift. For example, looking at the number of foreclosures and underwater mortgages gives a good sense of the strength of the overall industry.
Since the pandemic, the robust housing market has kept the number of distressed properties low throughout much of the country. Foreclosures and the proportion of seriously underwater mortgages (those with the combined balance of loans secured by the property totaling at least 25% more than the property’s market value) remain down. But the strength of the market has led to increasing home prices that are making homes less affordable for average wage-earners.
To afford a median-priced home in 109 of the counties analyzed in the report, homebuyers would have to spend more than half of their annual income to cover all the initial expenses involved, including the downpayment and mortgage. Nationwide, typical homebuyers spend just under one-third of their annual wages to purchase a median-priced home. While that number is considered more affordable, it applied to less than half of the counties analyzed in the report.
In fact, housing expenses surpassed the national rate in 59.3% of the counties studied (339 out of 572). The counties where homebuying initial expenses consumed the highest percentages of annual wages this past first quarter include: Kings County, N.Y. (109.5% of annual salary); Maui County, Hawaii (101.5%); San Luis Obispo County, Calif. (100.1%); Orange County, Calif. (97.8%); and Marin County, Calif. (97.5%).
On the other end of the spectrum, the 50 least risky counties were generally more affordable, though not by a large margin. In the top 50 counties that were least at-risk, typical homebuyers had to spend less than one-third of their annual salary to buy a home in 38% (19 out of 50) of the areas analyzed; in the most at-risk top 50, that figure was 30% (15 counties).
Out of the 50 least risky counties, several areas stood out for the low percentage of annual wages required to purchase a home. The counties with the lowest portion of income needed for homeownership were Madison County, Ala. (21.4%); Sullivan County, Tenn. (21.6%); Morgan County, Ala. (23.3%); Midland County, Texas (25.6%); and Durham County, N.C. (26.4%).
The highest percentage of the least at-risk counties were clustered in the South. More than half of the top 50 (27) were in Southern states, followed by 12 in the Midwest and seven in the Northeast. Tennessee led the way with nine counties in the top 50, followed by Virginia with seven. And while large metropolitan areas tend to be the most expensive, several were included in the least at-risk top 50. These include Fairfax County, Va. (including Washington, D.C.); Honolulu County, Hawaii; Hennepin County, Minn. (including Minneapolis); and Wake County, N.C. (including Raleigh).
By looking at the factors of affordability, employment and distressed properties, homebuyers and their trusted advisers can understand the health of their local market and be better prepared to deal with the risks inherent in the acquisition of residential property — despite the uncertainties of larger economic forces.