
The U.S. industrial real estate market staged one of the most dramatic booms in modern commercial real estate history between 2020 and 2022, driven by the pandemic-era surge in e-commerce demand, supply chain restructuring and speculative development.
Nowhere was this more visible than across six high-growth Sun Belt markets: Atlanta; Austin, Texas; Houston; Nashville, Tenn.; Phoenix; and San Bernardino/Riverside, Calif., which collectively attracted a disproportionate share of new industrial development.
The divergence between the Sun Belt six and the broader market is stark. Across the 41 non-Sun Belt industrial CRE markets in this analysis, average industrial vacancy stood at 7.2% in the first quarter of 2026. By contrast, the Sun Belt six averaged 11.6%, with Austin (18.9%), Phoenix (15.4%) and San Bernardino/Riverside (14%) the most acutely stressed.

Vacancy across the Sun Belt six rose an average of 6.5% from the 2022 low versus 2.8% for the rest of the market. Phoenix delivered 41 million square feet of industrial completions in 2023, and San Bernardino/Riverside delivered 32.5 million square feet. These markets added more in a single year than some markets hold in total inventory.
It sharpens the diagnosis to compare the Sun Belt six with the markets in Charlotte, N.C.; Dallas; Fort Lauderdale, Fla.; Fort Worth, Texas; Jacksonville, Fla.; Memphis, Tenn.; Miami; Orlando, Fla.; Palm Beach, Fla.; Raleigh-Durham, N.C.; San Antonio; and Tampa, Fla.
The two groups have nearly identical demand. The other Sun Belt CRE markets averaged 9% population growth from 2019 to 2025 versus 9.6% for the Sun Belt six, and industrial employment growth of 7.7% versus 7.5%. Yet the average vacancy in the other Sun Belt markets stood at 8.7% in the first quarter, roughly 3 percentage points below the Sun Belt six, with trough-to-current deterioration of just 3.7%.
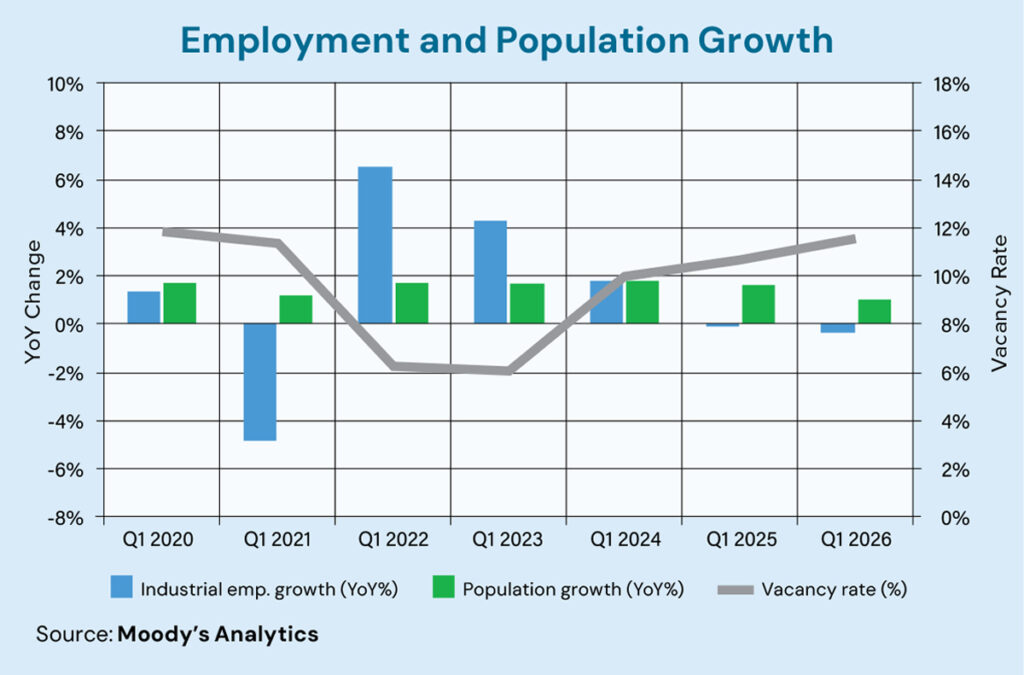
The Sun Belt six’s elevated stress is a product of development decisions, not demand fundamentals. Population across the Sun Belt six grew an average of 9.6% from 2019 to 2025, more than twice the 3.8% recorded across the other 41 markets, while industrial employment rose 7.5% compared with a 1.7% decline in non-Sun Belt markets.
Yet demographic strength does not automatically translate into industrial absorption; the composition of that growth matters. For example, Austin’s labor market, while ranked near the top in job growth in 2025, is dominated by technology, professional services and government sectors that do not lease warehouse space. Austin’s trade, transportation and utilities employment represents just 15% of its total workforce, the lowest in the group.
The San Bernardino/Riverside industrial employment base contracted from 184,000 jobs in 2019 to 175,000 jobs by 2025, the only market in the group with a declining industrial workforce. Asking rents are priced nearly 40% above the Sun Belt six average, giving tenants with flexible location requirements a strong incentive to look elsewhere.
Not all six are equally stressed. Nashville and Atlanta demonstrate what supply discipline produces within the same demographic. Nashville recorded 9.7% population growth and 10.9% industrial employment growth, yet the industrial vacancy rate stood at just 5.4% in the first quarter, having delivered a mid-tier number of completions in 2022-24. Atlanta, with a vacancy rate of 6.8%, essentially unchanged from its 2022 low, absorbed its cycle supply without lasting damage.
Houston, despite a large pipeline, is stabilizing at a 9.3% vacancy rate, bolstered by port-adjacent logistics demand and a 465,000-strong industrial workforce. By contrast, Phoenix, Austin and San Bernardino/Riverside face vacancy levels that will take years to normalize — not because their populations are shrinking, but because development pipelines ran ahead of the industrial demand their economies generate.
The Sun Belt industrial story of 2020 to 2026 is one of optimism that outran its own fundamentals. Population, household formation and industrial employment grew faster in these six markets than nationally, yet development still outpaced fundamentals in four. Nashville’s experience is instructive: Equally fast-growing but far more disciplined in supply delivery, it avoided the correction entirely.
The differentiating factor across all markets is not demographics but the alignment between the type of growth, the type of space built and the pace of delivery. Where labor markets are oriented toward logistics and industrial production and supply is matched to demand, recovery is already underway. Where construction outpaced industrial demand fundamentals, the road back to equilibrium is measured in years.