Industrial demand in the U.S. and Canada rebounded in the second quarter as both countries worked through increased trade uncertainties that began in 2025, according to a report from the real estate services company Lee & Associates.
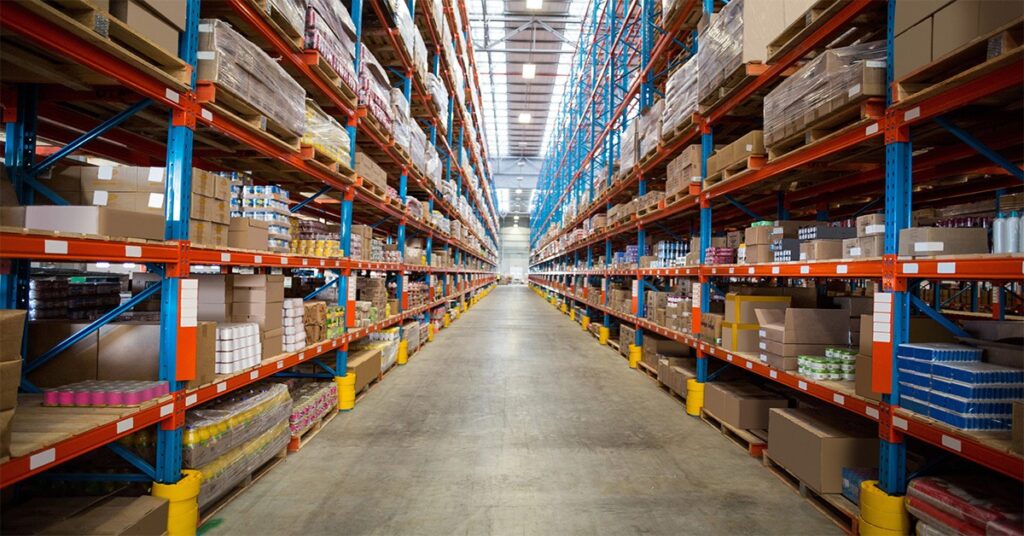
The U.S. recorded a net absorption of 44.4 million square feet in the industrial and warehouse sector in the second quarter, and a total of 77.1 million square feet for the first half of 2026, which is about 30% less than the five-year average absorption rate prior to the COVID-19 pandemic. In the first half of 2026, Canada’s industrial market absorbed more property than in the past two years combined.
U.S. deliveries in the first half of 2026 reached 93 million square feet, the least amount completed in seven years. Lee & Associates writes that while there has been a slowdown in new supplies, tenant demand has declined during the past three years, resulting in excess levels of existing facilities, particularly in trade-dependent markets. The overall vacancy rate in the U.S. rose slightly to 7.5% in the second quarter, while Canada’s vacancy rate sat at 4.6%.
The Dallas-Fort Worth market led the way in absorption with 28.7 million square feet. Phoenix was second with 23.5 million square feet, followed by Houston absorbing 15.5 million square feet and Indianapolis leasing 12.7 million square feet.
The report found that the North American office sector is having its best year since the COVID-19 lockdown of 2020. Vacancy declines were seen across the U.S. and Canada for the first time since 2019, and institutional investors are showing increased interest in premium assets.
With little new product on the market, and obsolete properties being redeveloped, total inventories for the U.S. and Canada have declined together for the first time on record.
The U.S. office market saw net growth of 16.7 million square feet in the first half of the year and is on track to halt its six-year slide in tenant expansion. Canada saw strong year-to-date net absorption of 4.4 million square feet and is on pace to eclipse the full-year 5.4 million square feet of net absorption in 2019.
On the negative side, Lee & Associates writes that there are many distressed office properties in bad locations. Some of those properties have been marked down in value by more than 90%.
Average values in high-quality properties have fallen by an average of about 35%. But “the gap between winners and losers is widening as tenants migrate toward quality,” the report noted. The average U.S. vacancy rate is 13.8%, while the Canadian vacancy rate is 9.8%.
North American retail properties continued to show resilience in the second quarter. Net retail expansion in the U.S. totaled 5.4 million square feet, a turnaround from the first quarter of 2026, which saw negative absorption of 4.7 million square feet.
Vacancy rates held steady in the second quarter, with the general retail category having a vacancy rate of 2.7%. Grocery-anchored neighborhood centers, which have been one of the bright spots in retail, had an average vacancy rate of 6.5%.
Apartment vacancy rates fell across North America as tenants took advantage of little-to-no rent growth during the period. The steady rents were caused by demand softening and multifamily construction slowing after developers pushed the apartment supply to a 40-year high in 2024, with annual net deliveries peaking at more than 690,000 units in the fourth quarter of that year. The U.S. is expected to add about 385,000 units this year, the fewest since 2019.