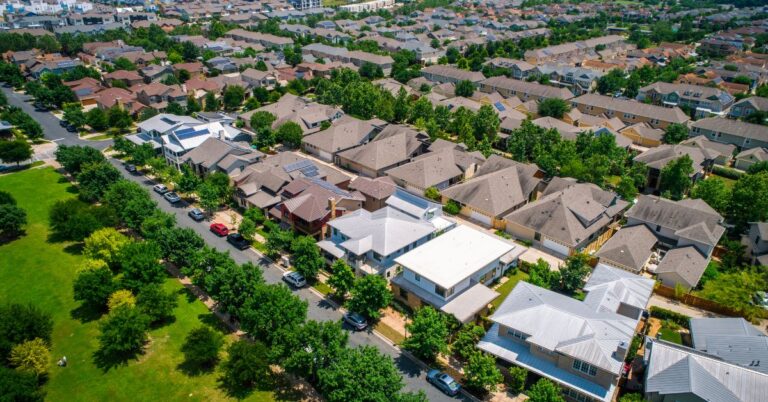

The national multifamily market has seen its vacancy rate rise over the last decade. New construction has expanded the national inventory by 26.6% over the period, lifting the national vacancy rate from 4.3% in the first quarter of 2016 to 6.8% over the first three months of 2026. While the country is at the tail end of the multifamily construction boom, data trends point to greater variation between Class A performance and classes B and C in recent years.
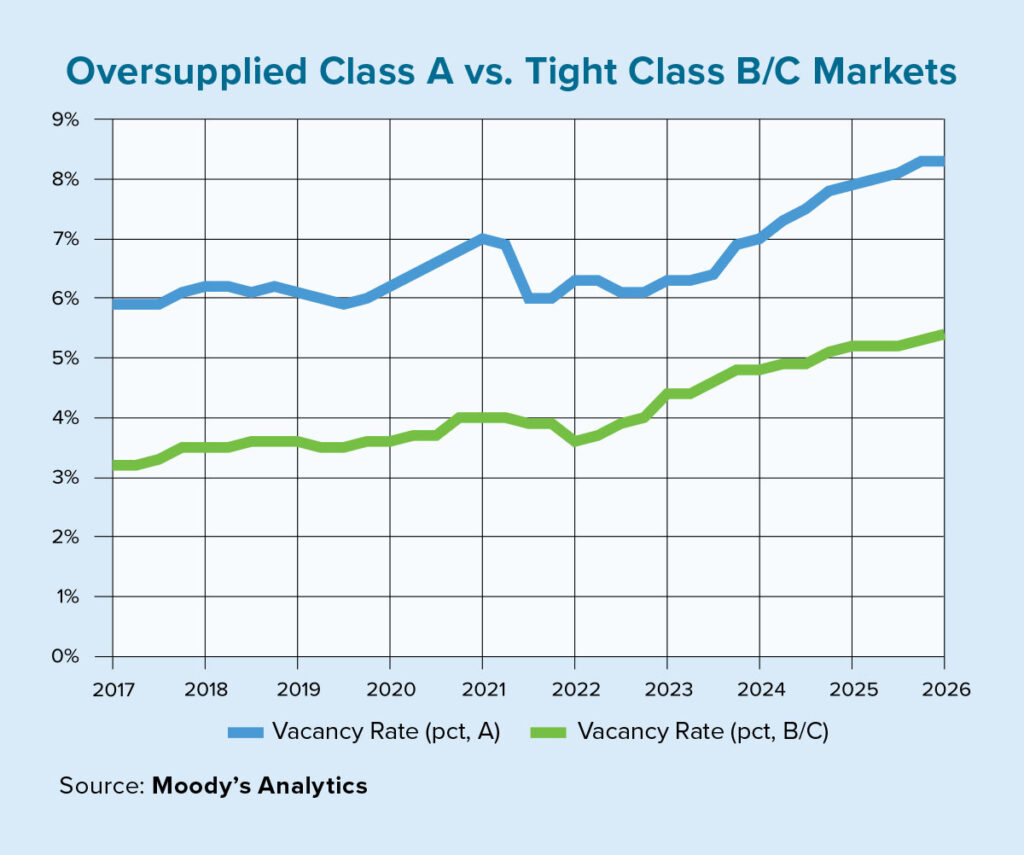
Prior to 2020, about 90% of annual apartment construction was Class A properties. As the construction boom has unwound, this share has retreated from its peak but remained elevated at 85% as of the first quarter of 2026. The record volume of Class A deliveries, peaking in 2024, has saturated the market, driving a steady increase in Class A vacancies over the past three years.
During the boom, construction costs rose sharply amid inflationary pressures, pushing Class A rents higher and widening the rent gap between Class A and B/C properties. As affordability pressures intensified for middle- and lower-income renters, fundamentals in the Class B/C segment remained more stable. While the vacancy rate has also increased for Class B/C properties, in the last three years the B/C vacancy rate has only risen by 100 basis points compared with Class A’s 200 bps rise.

Regional performance highlights a growing divergence in Class A market conditions, with significant construction activity in the Sun Belt. The Northeast and West remain the most competitive Class A regions, supported by structurally lower construction pipelines, land and regulatory constraints, and relatively resilient demand.
These factors have kept Class A vacancy rates in the Northeast and West well below those in other regions, allowing rent growth to remain comparatively elevated. As a result, the rent premium of Class A over B/C has continued to widen, particularly in the Northeast, where supply limitations have reinforced pricing power at the top end of the market.
Demand conditions have generally kept pace with deliveries outside the Sun Belt, especially in the Midwest. Rent growth in these regions has moderated but remains positive, and the Class A rent premium has widened more gradually, reflecting more balanced demand across a wide range of multifamily products.
By contrast, the Southwest has experienced the sharpest adjustment following the construction boom. Rapid supply expansion in recent years has pushed Class A vacancy rates into double‑digit territory, eroding landlords’ pricing power and placing sustained downward pressure on rent growth.
In these commercial real estate markets, increased availability of high‑end units has also limited further expansion of Class A rent premiums. The Class A vacancy rate in the Southwest rose by 330 bps over the last three years while increasing 240 bps in the South Atlantic region, highlighting construction growth across the Sun Belt. The other three regions have seen their Class A vacancy rates rise between 120 and 140 basis points over the same period.
Regional disparities in construction intensity and demand resilience shape a bifurcated Class A landscape, with pricing power concentrated in supply‑constrained regions and adjustment pressures most pronounced in high‑growth Sun Belt markets.
While regional variation has led to divergence, the suburban multifamily construction boom has led to greater urban-suburban convergence. Over the past year, 12‑month rolling suburban construction volumes have fallen by 30% from their mid‑2025 peak to levels consistent with the pre‑pandemic norm. This pullback in new supply has allowed demand to catch up and vacancy changes to stabilize.
By contrast, development activity in urban apartment markets is below pre‑pandemic levels, while demand for central business district (CBD) apartments has recovered, especially as return‑to‑office patterns reenergize interest in urban lifestyles, at least to some degree.
With supply constrained and demand firming, supply‑side pressures in CBD markets are easing. Driven by moderating suburban inventory growth and a rise in urban demand, oversupplied conditions are easing and realigning between urban and suburban counterparts. As a result, vacancy rate changes have moderated, and asking rent growth has held steady across both CBD and suburban apartment markets.